

This story is part of a group of stories called

Finding the best ways to do good. Made possible by The Rockefeller Foundation.
Have people gotten happier over time — or are we becoming more miserable as history marches on?
A group of researchers has developed a creative new way to tackle this question. Starting from the premise that what we write reveals a lot about our underlying feelings, they analyzed millions of books published between 1820 and 2009 and used the words in them to measure changes in subjective well-being in four countries: the United States, the United Kingdom, Germany, and Italy. They chose that time period and those countries because we’ve got sufficiently rich data for them.
The effort to track the happiness of large populations is not, in itself, new. In 2011, the Organisation for Economic Co-operation and Development (OECD) released its first well-being report on its member countries, and in 2012, the UN began releasing its annual world happiness report. Although these may be useful for tracking contemporary levels of well-being, they don’t give us a sense of how happy people were in previous centuries.
So, in a new study published this week in Nature Human Behavior, the researchers explain that they tried to reach further back in time by drawing mostly on Google Books, which contains over 8 million volumes — more than 6 percent of all books ever published. They also analyzed magazines and newspaper articles.
Of course, they couldn’t go through millions of texts by hand, so they used an algorithmic method called sentiment analysis, which purports to measure our positive or negative feelings from the words we use.
As in previous sentiment analysis studies, the researchers’ first step was to turn to preexisting databases containing thousands of words that people have rated based on how good or bad each one makes them feel. These large databases exist for English, German, and Italian, and they include words like “robber,” “kitten,” “cancer,” and “liberty.” The average rating for each word becomes the “affective word norm,” a measure of how much well-being a given word indicates.
Once researchers have those rankings, they find out how many times each word appears in the texts published each year in each of the countries they’re studying. On that basis, they claim to be able to compute how much well-being a population was experiencing in a given time and place.
What’s more, they can cross-reference the spikes or dips in happiness with world events and national policies that a population was subject to — things like civil wars, stock market crashes, or boosts in gross domestic product — to try to figure what type of event leads to the biggest uptick or downturn in well-being.
The researchers of the new study, who are based at the University of Warwick, the University of Glasgow, and the Alan Turing Institute in London, suggest that their findings could help governments make better policy decisions by giving them quantitative data showing which factors to focus on if they want to improve citizens’ life satisfaction.
Here are a few of the most striking findings:
- Increases in national income do generate increases in national happiness, but it takes a huge rise to have a noticeable effect at the national level
- An increase in longevity of one year had the same effect on happiness as a 4.3 percent increase in GDP
- One less year of war had the equivalent effect on happiness as a 30 percent rise in GDP
This kind of data may be useful to OECD member states and other countries now focused on boosting their citizens’ well-being. There’s Bhutan, which in 2008 enshrined “gross national happiness” in its constitution. There’s the United Arab Emirates, which in 2016 appointed a minister of state for happiness. And there’s New Zealand, which earlier this year released the world’s first-ever “well-being budget.” To measure progress toward increased well-being, the government there will use 61 indicators tracking everything from loneliness to water quality. But it doesn’t necessarily know how much weight to give to each factor.
A quantitative analysis, like the one in the new study, could theoretically help policymakers figure this out. But we should be very cautious about using sentiment analysis as a guide to policymaking.
Breaking down happiness levels by country
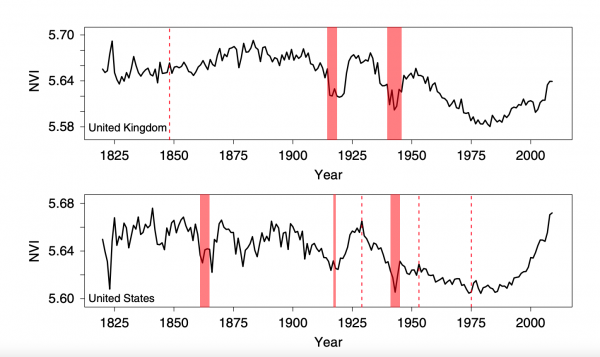
How have the US, the UK, Germany, and Italy fared over the past 200 years? The study’s National Value Index shows how happiness has shot up and down. In the charts below, the red shaded areas correspond to World War I, World War II, and other important events.
In the US, there’s another shaded area that represents the Civil War (1861 to 1865), which unsurprisingly entailed a dip in well-being. The dotted red lines coincide with the Wall Street stock market crash (1929), the end of the Korean War (1953), and the fall of Saigon (1975), respectively.
“What’s remarkable is that national subjective well-being is incredibly resilient to wars,” lead author Thomas Hills said in a statement, adding:
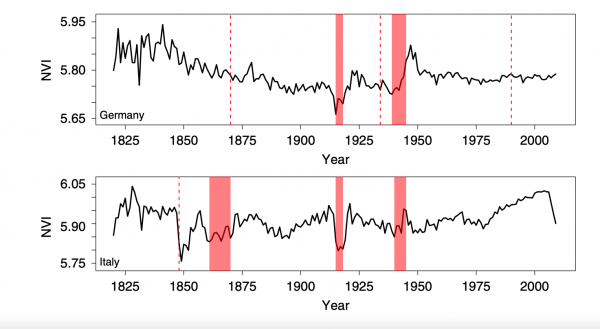
Looking at Germany, the dotted red lines represent the end of the Franco-Prussian War and reunification (1870), Hitler’s ascent to power (1934), and the reunification (1990), respectively.
In Italy, there’s an extra shaded area corresponding to that country’s unification (1861-1870).
“Looking at the Italian data,” said co-author Eugenio Proto, “it is interesting to note a slow but constant decline in the years of fascism and a dramatic decline in the years after the last crisis.”
The researchers validated their measures by comparing them with existing surveys of well-being — the Eurobarometer survey and the World Database of Happiness — and showing that their measures are highly consistent with these established surveys. The surveys ask questions like “On the whole, are you very satisfied, fairly satisfied, not very satisfied, or not at all satisfied with the life you lead?” But they only go back a few decades, so they can’t tell us how people felt a century or two ago, and that’s why the new study was deemed necessary.
The researchers also note: “Our specific approach is directly supported by a study of 17 million blog posts, which found that a simple calculation on the basis of the weighted affective ratings of words was highly accurate (70 percent) at predicting the mood of blogs as provided by the bloggers themselves.”
Nevertheless, there are some inherent limitations to sentiment analysis studies. It’s important to consider these before jumping to the conclusion that such a study can be reliably used to inform policy.
How much should we trust sentiment analysis?
Over the past few years, sentiment analysis has been embraced by for-profit companies, social scientists, journalists, and many others who want quantitative tools to help them parse the changing moods of a population.
The approach has been used with varying degrees of success in scientific studies. By applying sentiment analysis to people’s Twitter and Facebook posts, researchers have worked on predicting everything from stock market trends to seasonal mood variations to depression in patients.
But we should take the new sentiment analysis study with a grain of salt. It’s important to remember that it’s measuring subjective well-being, not objective well-being as determined by physiological measures like levels of cortisol (the primary stress hormone). And due to cultural differences, people in one country may be inclined to hyperbolize their sense of unhappiness, while people in another may tend to downplay it.
Plus, predictive algorithms are generally terrible at understanding social context, and that really matters. To take just one example, you know that if a teenager describes something as “killer,” she probably means it in a good way; if a news article talks about a “killer,” something gruesome has probably happened. As a human reader, you intuit this, because you understand context. But it’s just the sort of thing an algorithm might miscategorize.
“At this point, what we have is really, really crappy software,” Meredith Broussard, a New York University data journalism professor and author of Artificial Unintelligence, told me. “Computers can’t understand nuance or jokes.”
She added that sentiment analysis and other predictive AI tools generally have high error rates because they’re limited to conducting a fundamentally mathematical analysis of language — looking at how many times a given letter occurs, how often it occurs beside another given letter, and so on. These patterns are not how we humans understand language. We identify concepts and fit them into bigger frameworks of meaning.

Related to this problem is the question of whose words we’re analyzing — and whose words are getting left out. Oppressed minorities, if they’re able to air their true views at all, tend to do so in marginal publications or grassroots pamphlets (think, for example, of the role zines have played in the LGBTQ community). These texts are less likely to show up in Google Books.
The authors of the new study acknowledge this problem. “As our data are drawn from public text, it may be subject to censorship,” they write. “The case of Germany in the 1940s, when negative portrayals of the Nazi regime were censored, is a case in point.”
The authors try to control for censorship in the study by introducing a variable aimed at capturing how democratic a society is and by using “diverse corpora” — a wide array of books, newspapers, and magazines.
But as they themselves say, “no control can be perfect.”
So, while this study provides an interesting window onto people’s shifting sense of well-being as reflected in their writing, it’s not the sort of research that should, on its own, guide the decisions of policymakers.
Sign up for the Future Perfect newsletter. Twice a week, you’ll get a roundup of ideas and solutions for tackling our biggest challenges: improving public health, decreasing human and animal suffering, easing catastrophic risks, and — to put it simply — getting better at doing good.
Sourse: vox.com